This article was published in Vol. 3 No. 1 of the print edition.
Global Overview
In its standard annual article in 2021, Visual Capitalist showed that global GDP—calculated on a country by country basis—amounted to a total of 94 trillion dollars.1 This is a stark contrast to the world dominated by the G7 group, as it was as recently as twenty years ago. If we look at the world economy when the G7 group was founded in 1973, we see a completely different picture. The G7 looks like Snow White with six dwarfs. In 1973, the USA made up 30 per cent of the world’s GDP.2 This is a remarkable feat considering that the USA in that year had approximately 5 per cent of the global population. It was a triumph of productivity and human achievement.
Over the last thirty years, things have changed dramatically. New powers have emerged, and new economies have become significant on the global stage. Very often, the world powers behave like gangs of schoolchildren. If several children form a group and do not let other kids join in, the excluded will form a group of their own. This is exactly what happened with the G7 and BRIC countries. Since the G7 did not recognize the rise of new economic powers, the new powers started a group of their own. Although globalization meant economic intertwining for every country, it did not mean power sharing or an equal footing in terms of economic and political significance.
Table 1 shows the economic strengths of each group. With the inclusion of the European Monetary Union (EMU) and the broader economies of the EU as a whole, the G7 group does have a significant economic advantage in terms of size over the BRIC group. But if we just look at the ‘old countries’ which started the G7, the BRIC countries are now the equals, in terms of economic size, of all other G7 countries except the USA. Also, it is clear from the table that should the G7 stick to its numerical GDP, Italy and Canada should be out, and China and India should be in. But this is not how globalization has worked, and after the start of the war in Ukraine it is clear we have new global relations which have to be urgently addressed.
| G7 | BRIC |
| USA: 22.9% | China: 16.7% |
| Japan: 5.1% | India: 2.95% |
| Germany: 4.2% | Russia: 1.65% |
| UK: 3.1% | Brazil: 1.65% |
| France: 2.9% | Total: 22.95% |
| Italy: 2.1% | Saudi Arabia: 0.8% |
| Canada: 2% | Iran: 1% |
| Total: 40.2% | Total: 24.75% |
| Total with EU: 47.6% |
This article looks at the state and current economic role in the world of the European Union. The article does not dig deeply into political relationships, but rather looks at the data from financial markets and tries to determine how the financial market currently perceives the EMU and the euro as a global currency.
The global economy is slowing down. This slowdown is being interpreted as a recession due to the rise of prices and restrictive monetary policy employed to fight inflation. However, if we look at the data we see a different picture. This is indeed one cause of economic slowdown, but it is not due to restrictive monetary policy per se. The economic slowdown is due to the fact that the EMU is losing its economic importance. The two graphs below clearly show that global production is decreasing. The global PMI index has moved into contraction territory.
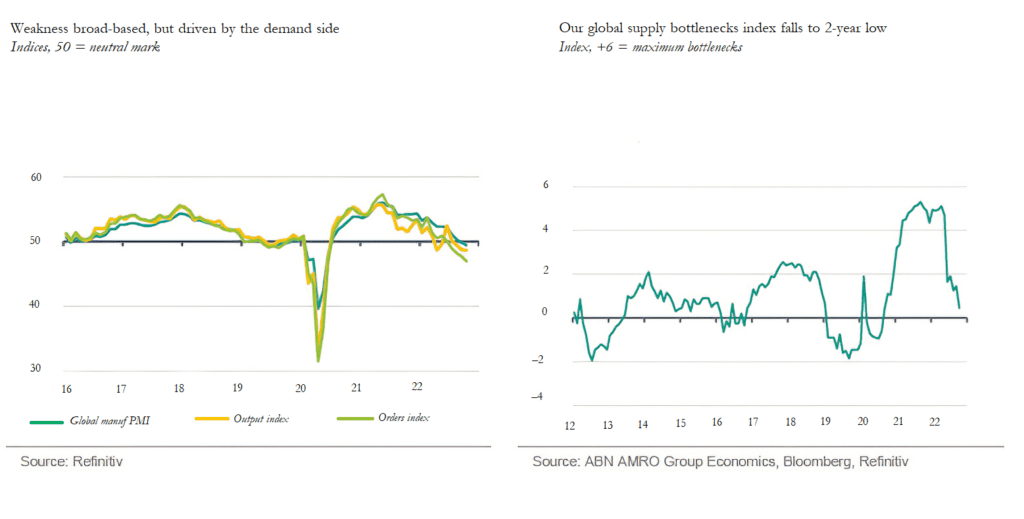
At the same time, the index of global supply bottlenecks has decreased considerably. In normal times, these data would be contradictory. Over the last year we have heard on numerous occasions that the reason for inflation in the EMU is supply bottlenecks, but as we can see that while these have since eased, inflation has not. The problem of supply chains is no longer a problem. This means factories can now get the goods they need for production, or the actual products can get to customers and meet the high demand. Looking at the global supply bottleneck index, we can see a high correlation with the global business cycle. The index was negative in 2012 during the euro crisis. It became negative again in 2016 when global economies slowed. From 2016 to 2019, we saw a very synchronized global business cycle. The global economy expanded and the index of bottlenecks increased.
The index is a very good proxy for the state of the global economy. The existence of mild bottlenecks is highly desirable. It means that goods are flowing and economies are growing. This explains the value of the index over two in 2018. An absence of bottlenecks means that there is much less economic activity and economies are contracting. This is the reason why the index turned negative in 2012.
Inflation in the EMU is 10 per cent (YoY November 2022); the alleviation of the supply chains strain did not cause inflation to decrease. Therefore, the supply chain bottlenecks are not the problem, nor the cause of inflation in the EMU. Recent projections for 2023 show that expected growth for the Eurozone is –0.9 per cent, inflation is 5.1 per cent, and unemployment should increase from 6.7 per cent to 7.3 per cent. The combination of high inflation, negative growth, and decreasing employment clearly means the EMU must expect to enter full-blown stagflation in 2023.
| Bln € | ECB securities held for monetary policy purposes | Public debt |
| Q4 2021 | 4,723 | 11,741 |
| Q2 2022 | 4,963 | 12,101 |
| NET | +240 | +360 |
EU Financial Markets
The data presented in the previous section showed us the global picture. There is a slowdown in global growth. The economies of a once highly globalized world are drifting apart. The EMU economy is being hit particularly hard. The recession is coming and, according to projections, the EMU will soon enter stagflation, the worst of economic states.
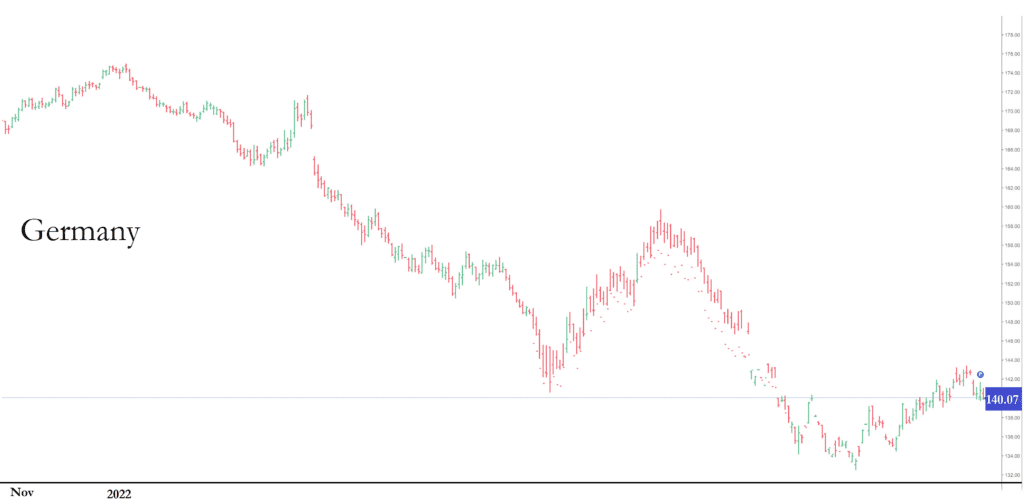
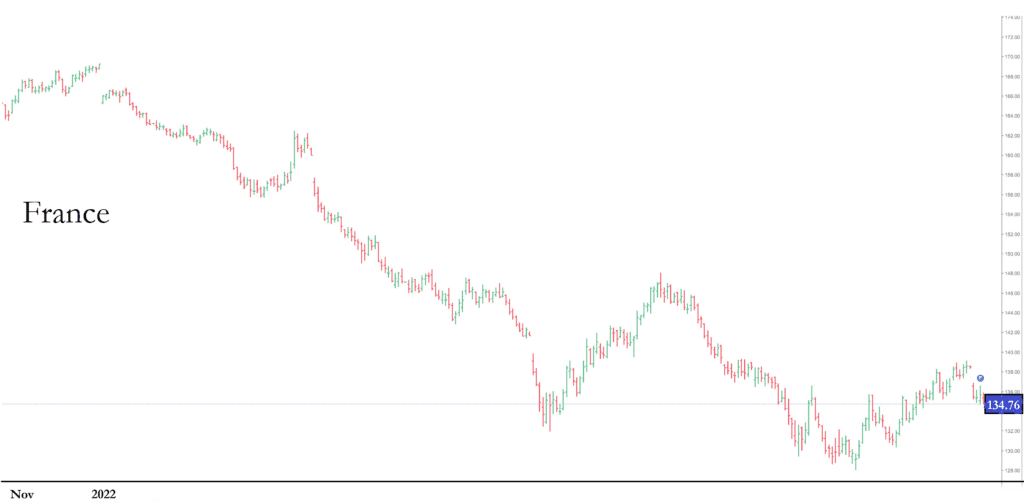
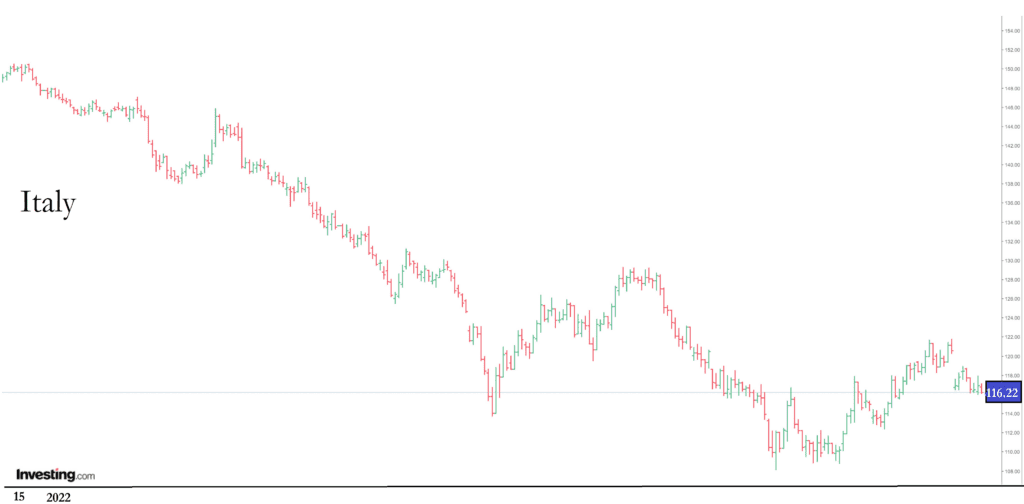
Let us now examine capital flows. In order to determine what is going on with capital flows, we are going to look at the government bond and currency markets. The three graphs on the previous page show the prices of 10-year German, French, and Italian bonds.
There is no doubt these bonds are not a desirable investment. There is a clear downward trend which lasted throughout 2022. The fall in prices could reflect two factors: the first factor is too much supply. Table 2 shows the total supply of government bonds in the first half of 2022 and the amount purchased by the ECB.
As we can see, once the purchases by the European Central Bank (ECB) are taken out, the increase in supply of eurozone bonds in the first half of 2022 is just 120 billion euros or around 1 per cent of the eurozone’s GDP. This increase in supply could hardly cause such a precipitous fall in bond prices. Therefore, the decrease in bond prices cannot be attributed to the oversupply of bonds. This brings us to the second possible reason for prices to fall: an absence of demand.
Since bonds move inversely with yields, to get a feel for how much the price of bonds has fallen in terms of interest rates, we are going to compare the change in US 10-year yields and yields on 10-year bonds of Germany, Italy, and France. We will look at the time period from 31 December 2021 to 30 June 2022. Keep in mind that during this time the FED has increased its main policy rate by 1.5 per cent and the ECB has not changed its rate at all.
From Table 3 we can see the EU interest rates have moved just as much as those in the US, with Italian yields moving considerably more. During this time period, the Federal Reserve increased interest rates and started to conduct quantitative tightening while, as we saw from the data, the ECB did not raise interest rates and continued to engage in quantitative easing. From this perspective, the move in eurozone yields is even more interesting.
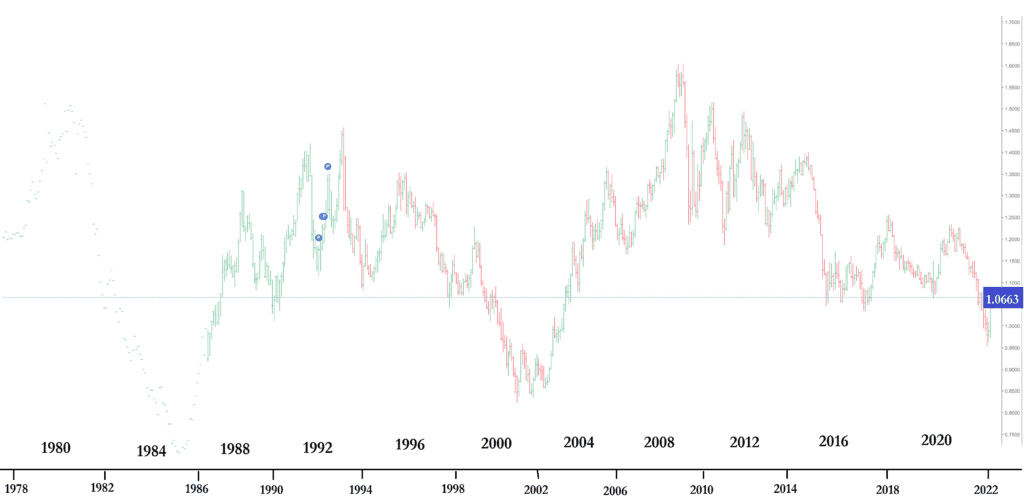
If we look at this graph of the euro currency, we can see a very similar and equally bleak picture. In the first half of the year, the euro has lost 20 per cent of its value and has fallen below parity. The effect of falling below parity cannot be overstated. If we trace the development of the euro since its inception, we can see that there were only two periods in its history when the euro fell below parity. The most recent one was in early 2000. That time period and the weakness of the common currency can be easily explained. The euro was a new currency and it needed to gain global acceptance. Once that acceptance had been gained, it strengthened quickly. The previous period was during the mid-1980s, which was the period of incredible strength of the dollar when coordinated G7 action was needed to push the dollar lower.
What does the above data tell us? Europe is faced with a massive capital outflow which is accompanied by a significant economic downturn. In simple terms, the EMU is no longer business-friendly. Very few want to do business in Europe, hold EMU debt, or use its currency.
| In per cent, end of day | 31 Dec. 2021 | 30 June 2022 | Change |
| US | 1.152 | 3.017 | 1.865 |
| Germany | –0.179 | 1.368 | 1.547 |
| France | 0.194 | 1.957 | 1.763 |
| Italy | 1.185 | 3.392 | 2.207 |
The New State of the Economy
There are several events in recent financial history that have changed the economic system as we know it. Their repercussions reverberated through various decades. Here is a list from the early twentieth century to the present.
- 1913: The banking crisis precipitated the creation of the Federal Reserve System, which is today the most important central bank in the world. Its decisions have global implications.
- 1929: The stock market crash in Wall Street, New York, launched the Great Depression. A period of low inflation and low interest rates ensued. This new state of the economy necessitated a better understanding of economic processes and consequently macroeconomics as a science was established.
- 1946: With the return of GIs from the war, consumer spending increased. The ‘pent up demand’ caused inflation to rise. The US economy was ejected from the equilibrium of low inflation, low interest rates, and low growth into a new state of higher inflation, higher interest rates, but also higher rates of economic growth.
- 1973: The rise of inflation was not understood or quickly answered by the FED, causing the US economy to enter into the worst economic state: stagflation.
- 1982: the monetary policy mix of restrictive monetary policy and fiscal expansion had a slingshot effect on the economy. First, restrictive monetary policy choked the economy and caused the worst economic crisis in the USA since the war, with unemployment reaching 10.8 per cent. The fiscal expansion kept the economy from collapsing. But once inflation fell, interest rates started to come down and the economy entered a period of decreasing interest rates, strong economic growth, and low inflation.
- 2008: Although not a game-changing year, the Lehman Brothers bankruptcy had two main effects. Many characteristics of the economy were similar to those of the Great Depression: low inflation, low interest rates, low rates of growth. One can argue that this was the termination of the economic state set in in 1982.
- 2021: Just like in 1946, the pent-up demand from the COVID lockdowns, helicopter money, and state welfare programmes pushed the economy from low inflation and low interest rates to a new state of higher inflation and higher interest rates.
From among the dates presented, we have already seen two years when the economy moved from low inflation and low interest rates into a new state of higher inflation and higher interest rates. Those were 1946 and 1973. The question which must be answered is the following: are we today in the state of the economy inaugurated in 1946 or are we in the state of the economy established in 1973? This question has to be answered either by policy makers who then translate their response into very firm economic policies, or the economy itself, evolving into a new economic state.
It is evident from the data presented above that in 1973 the EMU was on the cusp of stagflation. But this time, the EMU does not have the ability to use fiscal expansion as a monetary policy to break stagflation. The only path forward is to let the economy sort itself out, no matter what the consequences are for the general public.
There are several things which have to be addressed in relation to EU institutions, especially the ECB, in the new economic conditions. The ECB completely missed the shift to stagflation. ECB chair Christine Lagarde ignored and denied inflation, and now we have EMU inflation at 10 per cent. Projections made for the next year by ABN Amro for the EMU are: inflation at 5.1 per cent, GDP real growth at –0.9 per cent, and a rise in unemployment of 0.6 per cent. These numbers together exhibit the clear characteristics of stagflation. Thus, the right word to describe the policymaking of the ECB is disastrous.
Effects of Inflation on the Economy
Inflation has almost become a forgotten word. Inflation in Germany was 10.4 per cent in October 2022. This is the highest rate since the early 1950s. It means that only people now over seventy were living when inflation was this high. Probably nobody under 85 remembers the state of an economy suffering from inflation in the double digits.
For economies (all G7 economies) the standard interpretation of inflation is that it is an economic occurrence when prices go up. Then the central bank raises interest rates, decreases economic activity, and the change in price rate (inflation) comes down. This is true from the standard theoretical and statistical point of view. But those who lived in the Eastern Bloc or have read a different kind of literature understand that elevated inflation rates have another important effect on the economy: negative redistribution.
In his book Possibilities to Suppress Inflation (1986), Croatian author Marijan Korošić3 writes that inflation is a disease. His analysis points to the fact that in Yugoslavia at the time, inflation was not just an economic variable, but that the whole structure of the economy became inflationary. Korošić painted a bleak picture of an economy where fiscal and monetary policies had completely and permanently destabilized the economy, so that it could no longer function normally. The role of the market to clear supply and demand is no longer possible in such conditions. Economic participants are not behaving rationally. What Korošić writes about has striking similarities to the EMU today.
High levels of inflation should not be measured in absolute but in relative terms. For decades, inflation in the EU was not a problem. Moving from deflation to double-digit inflation in just 24 months clearly shows that there is something deeply wrong with the economic system and structure.
High inflation creates a number of negative effects in the economy which are not currently being addressed by any economic policy-maker in the EMU. The first is the feedback price effect. As prices rise, some producers can no longer pay for their input goods, so they go out of business. But once they go out of business, their suppliers have no one to sell to, so they also go out of business. This causes a decrease in employment. It also creates a scarcity of goods, and this is the main characteristic of the supply side inflation so peculiar to stagflation.
The second effect is the redistribution effect. The loss of value affects savings and decreases real wages, which negatively impacts the poor. In stagflation, the loss of jobs and the loss of value of money is acutely felt by the poorest. Stagflation makes the poor much poorer. Unfortunately, however, the aforementioned two problems are not the core focus of the ECB or the EU Commission.
How Did We Get Here?
It is very important to understand how the EU got to this point. There are two main reasons for this: failure of leadership and failure of values. Both are significant, and each will be analysed. However, the approach will be slightly unorthodox, since it will be given from the perspective of a capital market participant.
As we have seen, the world is being reorganized, and the EU is helpless. Politicians do not have any clear vision or guidance. This can best be seen in the way the EU Commission is handling the sanctions imposed on Russia. On the very first day of the invasion, there were calls to stop importing oil, gas, and coal from Russia. This was considered a smart political response. Then Russia stopped selling energy, and European politicians proclaimed that Russia was using energy as a weapon. So, politicians get what they wanted and complain about it. After the four rounds of sanctions against Russia, the fifth was supposed to be ‘smart sanctions’, which by definition implies that the previous sanctions were stupid. The EU is currently on a ninth package of sanctions and, as we have seen, the economy which is in bad shape is that of Europe.
Market participants do not like this kind of policy-making. They have realized what kind of politicians are running Europe and, in consequence, they have left. The abandonment of investment in EU financial markets has been clearly presented in this article.
The politics of the EU has become a celebrity contest where each participant tries to say something which will give him or her the most likes on social media. The real effects of policies on the economy and on people are not truly thought out or analysed, and have dire consequences. This is a failure of leadership.
How about European values? There is a lot of talk about EU values, but how do they work in practice?
- Is destroying the Greek economy when help was needed a European value?
- Is challenging democratic elections in Hungary and Italy a European value, or is it democracy only when Brussels-approved candidates win?
- Is it sensible to punish countries with a clear set of values which might differ from Brussels-imposed European values?
- Is withdrawing EU funds, during an economic crisis, from countries which offer alternative policies, an EU value?
Maybe the only pertinent question is: how long can you stretch hypocrisy? Given such behaviour, it is not surprising that capital and goods are flowing out from the EMU. It is not surprising that nobody wants the common currency. It is not surprising that the EMU is entering stagflation. To paraphrase the trader Ed Sykota, everyone gets what they wanted from the markets, the only problem is people are not sure what they actually want and might not be happy with what they get.4
This article is based on a talk delivered at the ‘Second Summit on Geopolitics, Security and Defence’, organized by the Danube Institute, Budapest, on 1 December 2022.
NOTES
1 Dorothy Neufeld, ‘Visualizing the $94 Trillion World Economy in One Chart’, Visual Capitalist (22 December 2021), www.visualcapitalist.com/visualizing-the-94-trillion-world-economy-in-one-chart/.
2 YCHARTS, https://ycharts.com/indicators/us_gdp_ as_a_percentage_of_world_gdp.
3 Marijan Korošić, Inflacija i mogućnosti suzbijanja (Beograd: Naučna Knjiga, 1986).
4 Jack Schwager, Market Wizards: Interviews with Top Traders (New York: Wiley, 2012).