
Hungarian Conservative has launched a ten-part series of articles on the past decade and a half of the Hungarian economy and society, titled ‘Revealing the Facts’. Rather than looking at a lot of different, isolated data it is worth providing an overview, comparing and analysing trends over time, in order to understand the details. In the first instalment of our series we looked at inflation. In parts two and three we highlighted that growing incomes and the security of livelihood, both of which have been experienced under the conservative governments since 2010, are of primary importance for Hungarians. This article briefly explores the economic growth trends of the past decades in Hungary.
Hungary is an open economy, which means that it is highly dependent on global financial and economic trends and the influence of foreign capital. This is partly due to the country’s size and endowments, and partly to historically flawed economic policies.
After WWI, Hungary lost two-thirds of its territory and a significant part of its resources. After WWII, Hungary became part of the Soviet Union’s sphere of interest, and from the second half of the 1940s, a Soviet-style economic policy brought about radical changes: private assets were nationalized, and the supply-and-demand market economy was replaced by a planned economy.
This Soviet-type economic model quickly proved to be dysfunctional. By the time of the regime change in 1990, the Communist leadership had accumulated a substantial national debt, while the unsustainable operation and technological underdevelopment of state-owned enterprises would have left them with no chance of survival in a free market.
Before and After the Regime Change
After the fall of communism in 1990, Hungary’s economy had to be transformed from the ground up, with the opening up of the market and the re-emergence of privately owned assets after more than four decades of Soviet-style economic policy. At the same time, the economic transition increased the country’s vulnerability, and
the selling out of state property by the Communists further deteriorated the condition of an economy already bleeding from a thousand wounds.
Before the change of regime, in 1988, the Transformation Law came into force, which allowed private companies to be established alongside state enterprises. In practice, the law helped Communist leaders and the oligarchy to transfer the assets of state enterprises to newly established businesses of their own.
As a result, by 1990, when the effective market opening began, most of the state-owned companies had been eviscerated, leaving very few that could meaningfully compete with their more advanced Western counterparts.
During the 1990s, state-owned enterprises were privatized in whole or in part, allowing investors to acquire state assets for pennies on the dollar—or fillér on the forint, to be more appropriate. As a result of privatization, domestic ownership either completely disappeared in many sectors, such as retail, or could not be developed in any meaningful way, such as in the financial sector. This did not stimulate the growth of the Hungarian economy, and there was no real development and catching up with Western countries for decades.
The first Orbán government, formed in 2010, had little room for manoeuvre in its early years. The 2008 crisis brought a huge economic downturn from which recovery was delayed by the fact that the profit-making sectors were almost entirely in foreign hands, meaning that much of the profit generated here was taken out of the country.
More than twenty years after the change of regime in 1990, for the first time
an environment was created in which Hungarian companies could begin to catch up in market competition
and become real, inescapable players.
The Trends of GDP Per Capita
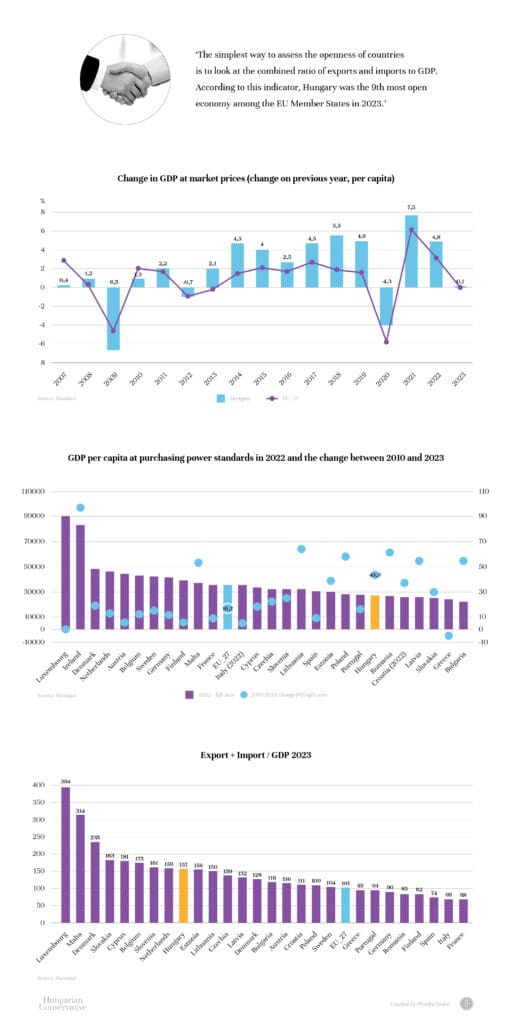
In Hungary, as shown in the graph, GDP per capita growth has been above the EU-27 average in every year since 2010, so the Hungarian economy has grown faster than the EU average. Our decline in 2020 was also below average, and even below the large decline in 2009—despite the fact that the EU average decline in 2020 was larger than in 2009.
In the first year of the Covid pandemic, only Ireland’s GDP per capita managed to grow. Ireland is home to the European headquarters of several tech giants, and because of the anomaly in the GDP calculation, they have to take into account purchases at Google and Facebook made from Hungary. During the epidemic, every country in Europe spent more on online services, and much of this was reflected in Ireland’s GDP.
In 2021 GDP grew in all Member States; in 2022 it fell in two states; and in 2023 it fell in 11. Hungary was not among the countries with a decline in any of the last three years.
As shown in the graph, Hungary’s GDP per capita grew by 43.9 per cent between 2010 and 2023, well above the EU average of 16.2 per cent, being the eighth highest among the Member States. While in 2010 Hungary’s GDP was 66.1 per cent of the EU average,
by 2022 it had risen to 76.1 per cent, surpassing Romania, Croatia, Latvia, Slovakia, Greece and Bulgaria.
Only second to Ireland, the strongest growth in the decade has been in the Baltic and Central European countries; the gap between Western and Central European countries has narrowed. According to the latest estimate by the Hungarian National Bank, Hungarian GDP growth could be around 2 to 3 per cent his year.
Hungary Is an Open Economy
The simplest way to assess the openness of countries is to look at the combined ratio of exports and imports compared to GDP. According to this indicator, Hungary was the nineth most open economy among the EU Member States in 2023. Our economy is linked to the rest of the world by a thousand ties. In the world in general, smaller economies are the open ones and larger ones are the closed ones. The Hungarian economy is much bigger than the Baltic countries or Croatia, for example, but we are much more open than even these small countries. This is because we have had far more state-owned companies bought up by foreigners than other countries that have changed regimes, and so we have a much higher share of companies in GDP with mostly foreign decision-making, so our exposure is higher.
Is it Correct to Assess Poverty on the Basis of GDP?
The globalist analysts, however, like to use GDP per capita when they want to make statements about poverty, which is an oversimplification. Fifty years ago, before such a wide range of data was available for economic analysis, it was indeed one of the most widely used indicators, but even then analysts were aware that it was not a useful indicator for designing poverty reduction programmes.
This simplification is due to the fact that it takes into account the output of organisations based in the area, rather than the population or households. For example, if an organization is based in Budapest, then all of its output is included in the calculation of GDP in Budapest, adding to the GDP of Budapest, even if, for example, the service of an electricity supplier is also used in Szabolcs County—one of the most poverty-stricken regions of Hungary. However, if the household expenditure in Szabolcs is paid for by a resident of Szabolcs to a company based in Budapest, it ‘enriches’ the capital. Alternatively, if that Szabolcs resident buys, say, a Facebook ad, it adds to Dublin’s GDP. Ireland’s GDP per capita has almost doubled since 2010 as a result of the output of these tech companies.
Other times, they try to make statements about poverty on the basis of household consumption derived from GDP. The figures show that the individual consumption of Hungarian households is among the lowest compared to the EU average. One reason for this is that we have the highest collective consumption as a share of GDP, which is not reflected in household statistics. Since 2015,
a very significant part of collective consumption has been spent on the protection of the southern border, and since 2014 on the maintaining of the utility costs reductions.
We also spend much more on family benefits, much of which does not appear in households as cash payments but increases collective consumption, e.g. in the form of free Erzsébet summer camps for children. The cost of these is not recorded with the household, as they are free to them, and their cost to the economy increases collective consumption.
The share of investments in Hungarian GDP is also high, which is due to the fact that we have not received any compensation for the EU developments that have been completed and delivered and are already being used by the population, which of course had to be pre-financed from the Hungarian GDP.
Conclusion
The success of Hungary’s economic policy is well illustrated by the fact that the Hungarian economy is now crisis-resistant, growth is driven by high value-added investments, and more and more Hungarian-owned companies are becoming major players in the global market. The period since 2010 has been one of the best decades for the Hungarian economy.
Piroska Szalai is a labour market expert, a researcher at Economy and Competitiveness Research Institute of the Ludovika University of Public Service.
Kristóf Nagy and Mátyás Zsolt Varga are journalists at Mandiner.
Related articles: